

Overview
When you send events to Flexprice, they go through multiple processing steps—validation, meter matching, aggregation, and billing. The Event Debugger lets you see this entire journey and quickly identify any issues.Accessing the Event Debugger
Navigate to Usage Tracking → Events Debugger in your Flexprice dashboard.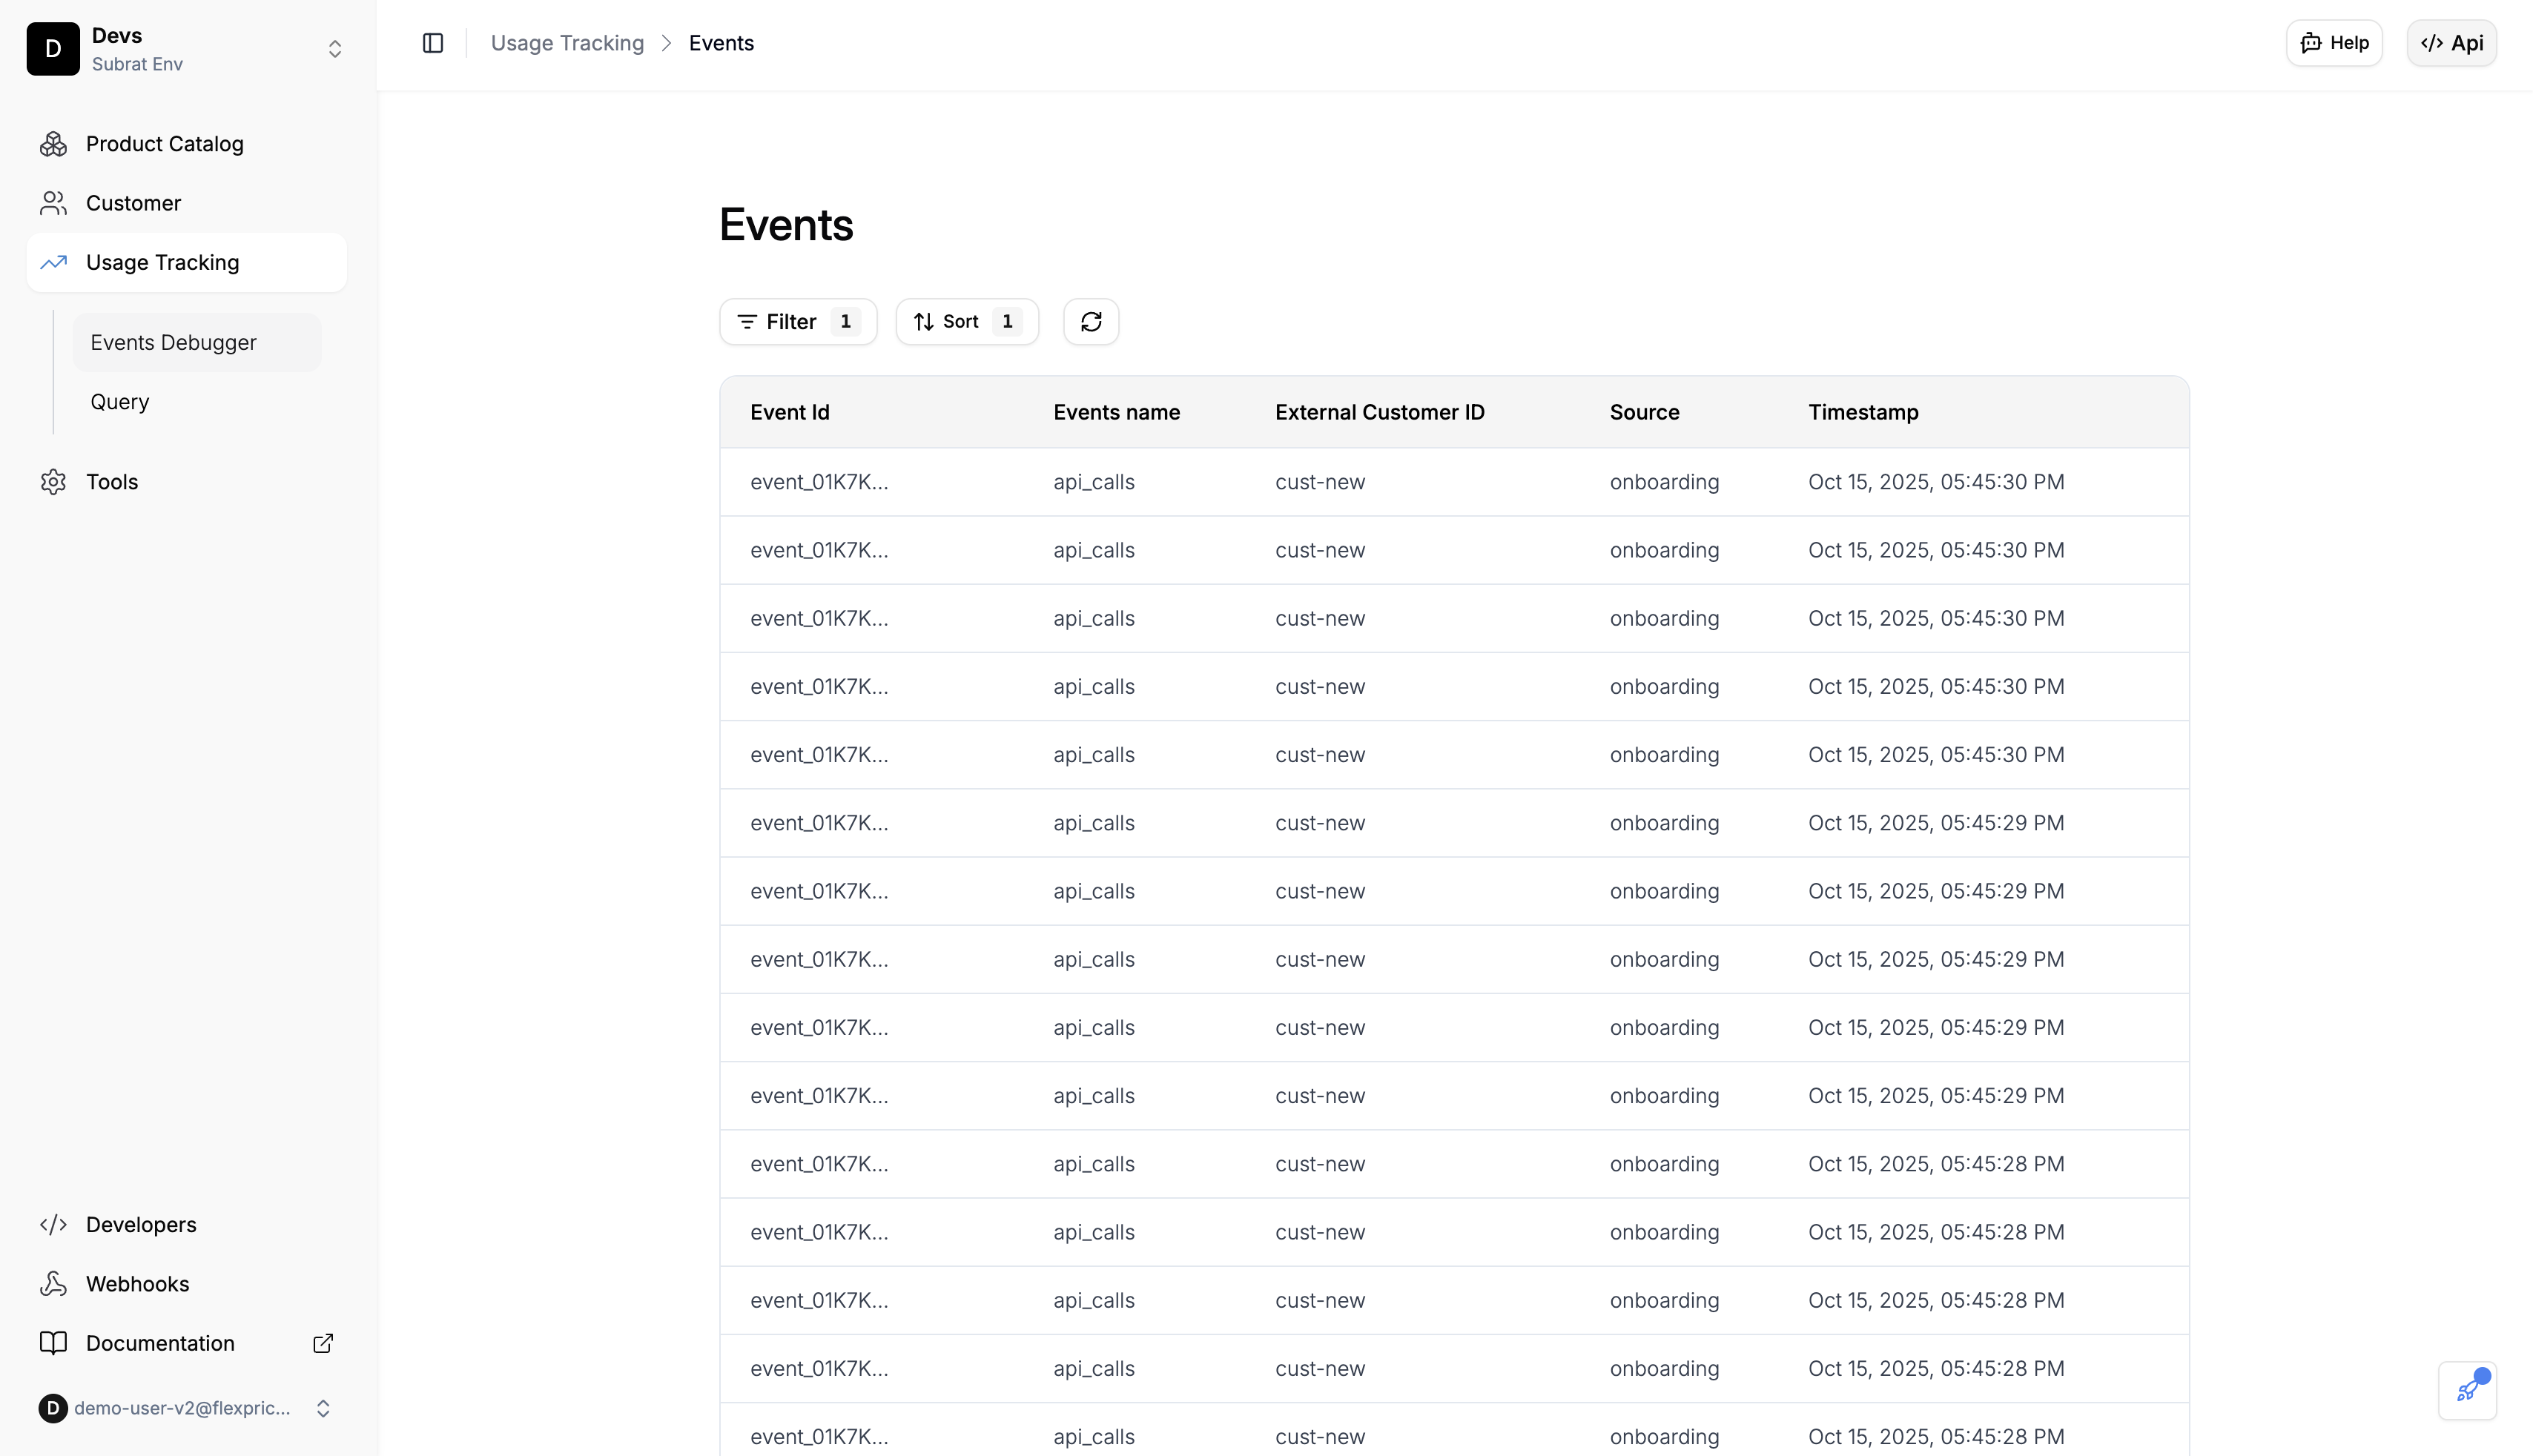
Viewing Events
Event Stream
The Event Debugger displays a real-time stream of events entering your system. Each event shows:- Event ID
- Event Name
- Customer Lookup Key
- Source
- Timestamp
Event Details
Click on any event to view complete details:Sorting Events
Click the Sort button to order events by:- Name
- Created At
- Updated At
Filtering Events
Use the Filter button to narrow down events. You can combine multiple filters:Filter by Event ID
Search for a specific event by its ID:Filter by Event Name
Filter by event type:Filter by Customer
Find events for a specific customer:Filter by Time Range
Find events after a specific time period using Start Time: Start Time (After):Filter by Source
Filter events by their source:Common Use Cases
Verify Events Are Being Received
After setting up event ingestion, check the Event Debugger to confirm events are arriving:- Navigate to the Events Debugger
- Look for your recent events in the list
- Click on an event to view its full details
Debug Missing Events
If expected events aren’t showing up:- Check that
event_namematches your metered feature exactly - Verify
external_customer_idis correct - Confirm the timestamp format is valid ISO 8601
- Check the source parameter matches your expected value
Find Events for a Specific Customer
To review all events for a customer:- Click the Filter button
- Add a filter: External Customer ID contains “your_customer_id”
- Click Apply to see filtered results
Review Events in a Time Period
To see events within a specific date range:- Click the Filter button
- Set Start Time (After) to your beginning date
- Set End Time (Before) to your ending date
- Apply the filters
Best Practices
Test Event Integration Early Send test events and verify they appear in the debugger before going to production. Monitor Regularly Check the debugger periodically to ensure events are being received correctly. Verify After Changes After updating metered features or plans, use the debugger to confirm events still process correctly. Use Filters Effectively Combine multiple filters to quickly find specific events you need to review.Related Documentation
Need Help?
If events aren’t appearing as expected:- Review the Sending Events guide to verify your integration
- Check the Validating Events documentation
- See the Troubleshooting guide for common issues